With FireGraph the knowledge graph for the fireservice, Netage B.V. created a COVID-19 dashboard for Amsterdam-Amstelland Fire Service. This dashboard provides easy to use insights on data around COVID-19 related incidents.
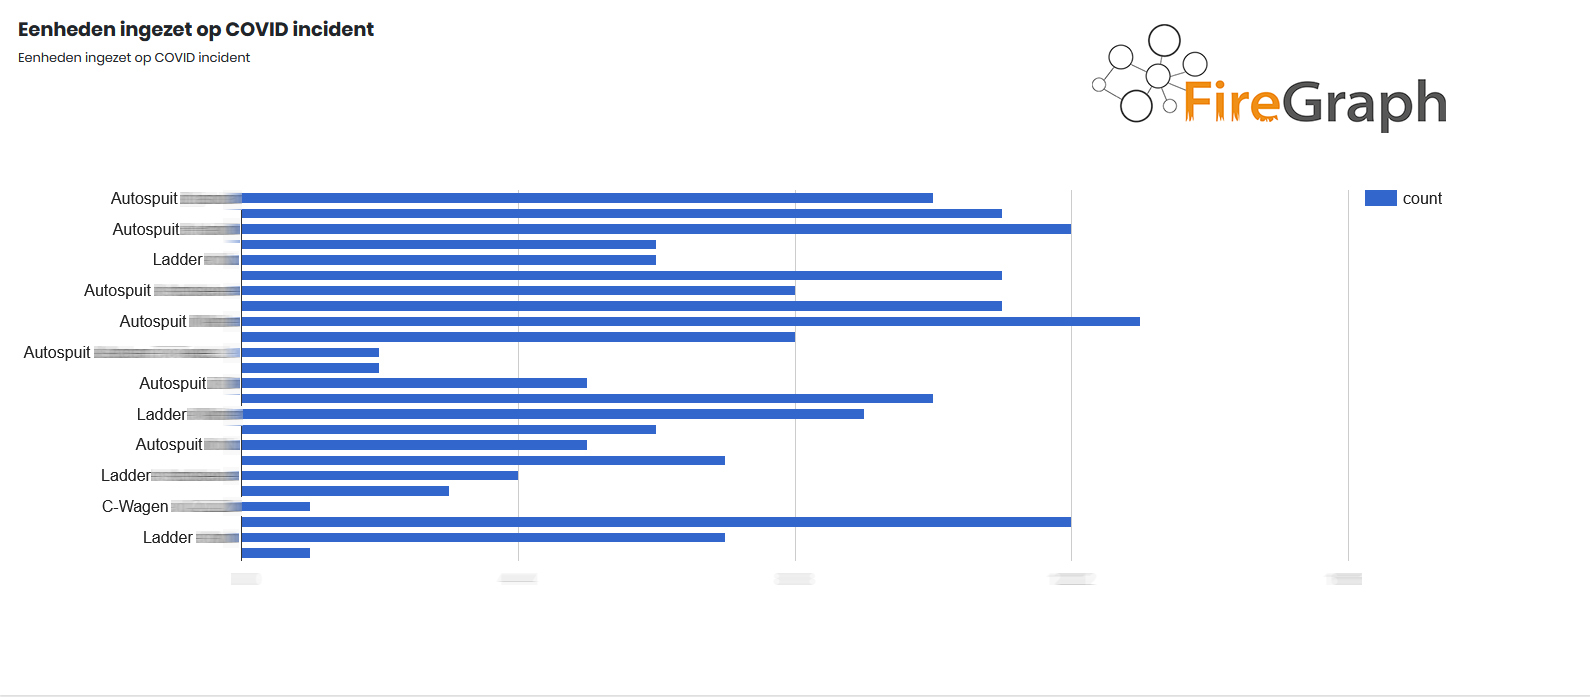
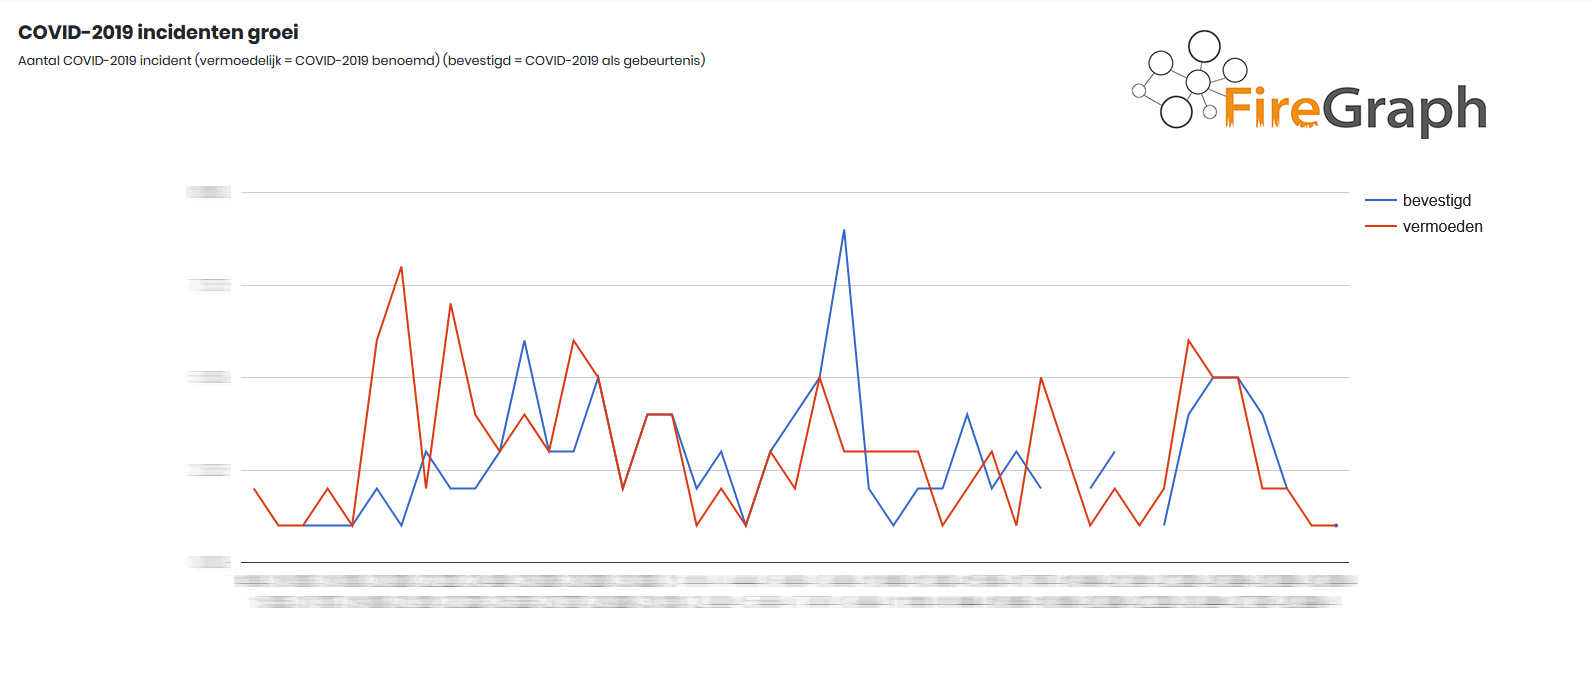
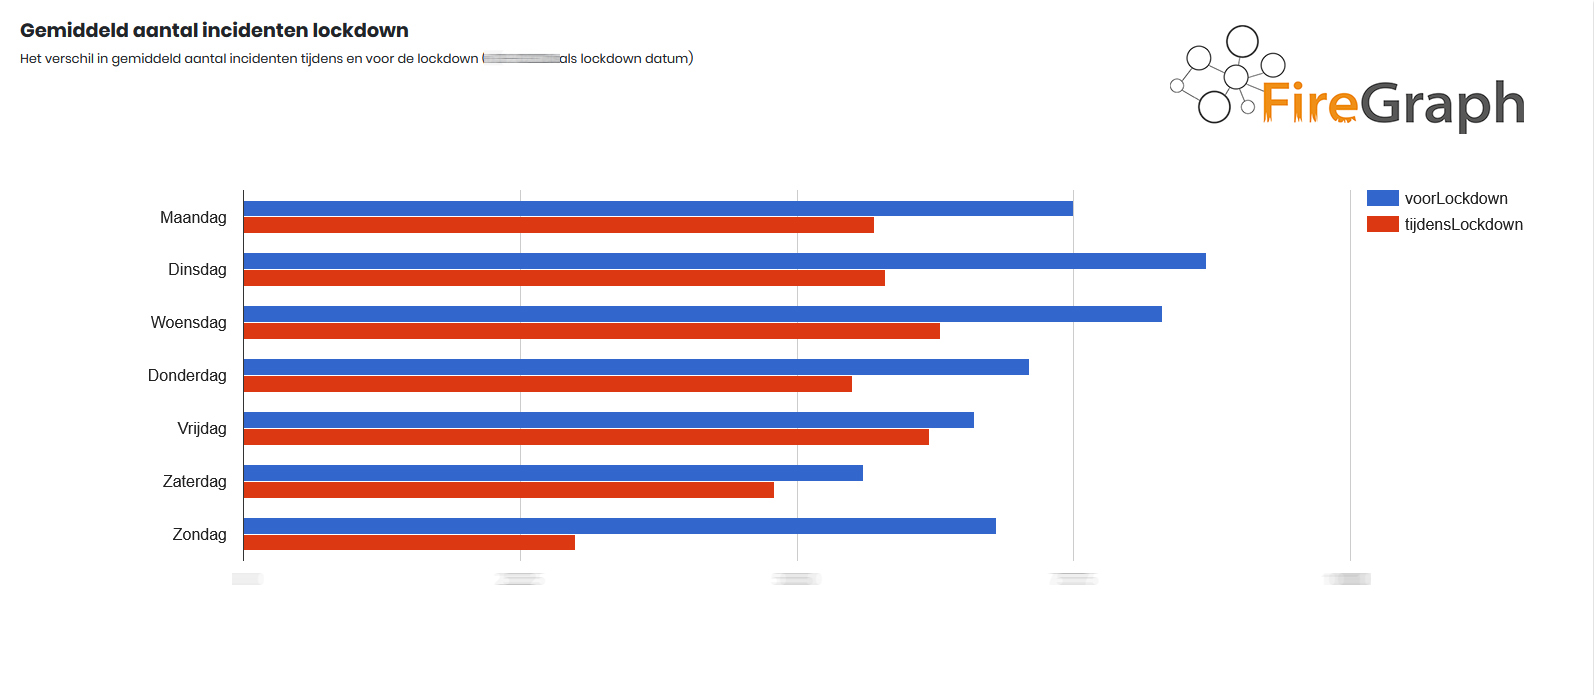
By using this dashboard it is possible to find relevant information around COVID-19 related incidents. Where were these incidents, how often and when. By combining line charts of the current situation compared to the normal situation it is also possible to spot trends in the emerging situation.
The total number of incidents show an interesting statistic as well, the nature of calls and their volume has shifted, although there are less fire calls, the time on scene did increase due to decontamination activities.
Since the incident data is mapped into the FireGraph knowledge gaph, it is also possible to easily combine the COVID-19 data with other data like Census data or building information where this is relevant.